


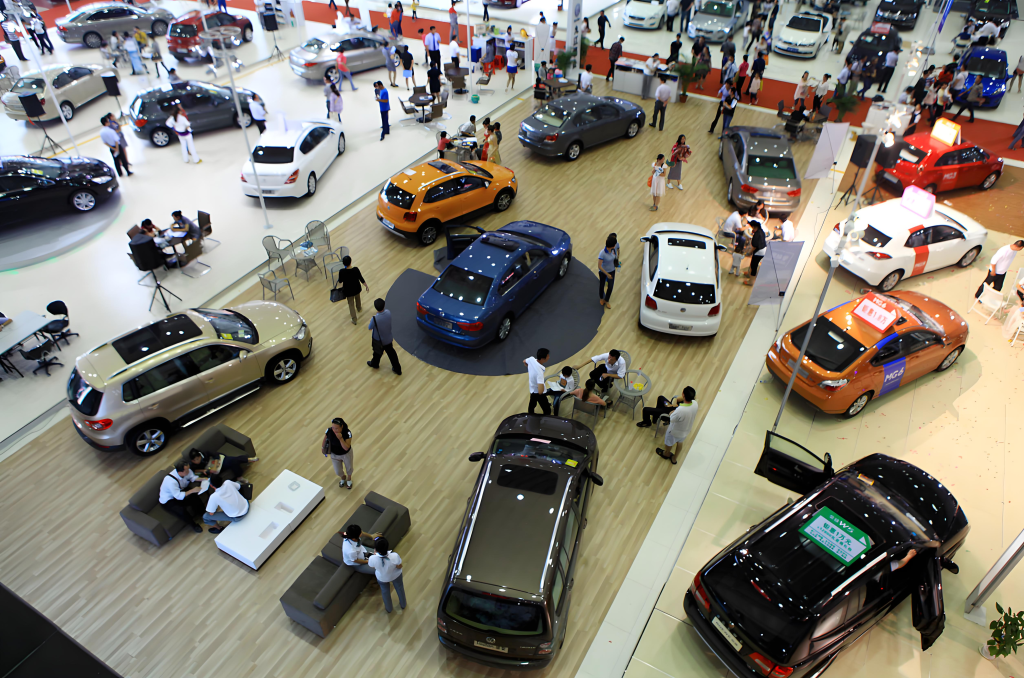
![[POLICY WATCH] CHINA’S 2025 CAR SCRAPPAGE SCHEME: HOW NEVS ARE RESHAPING THE MARKET](http://www.zingevs.com/wp-content/uploads/2025/07/388ec94d-e2cc-4894-97e0-48762c7e4d1d-1024x615.jpg)
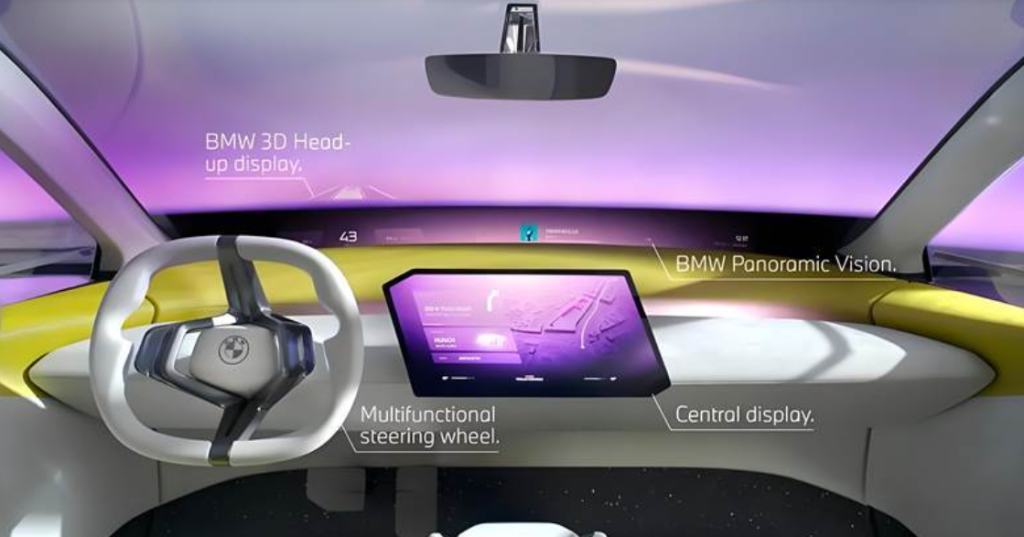

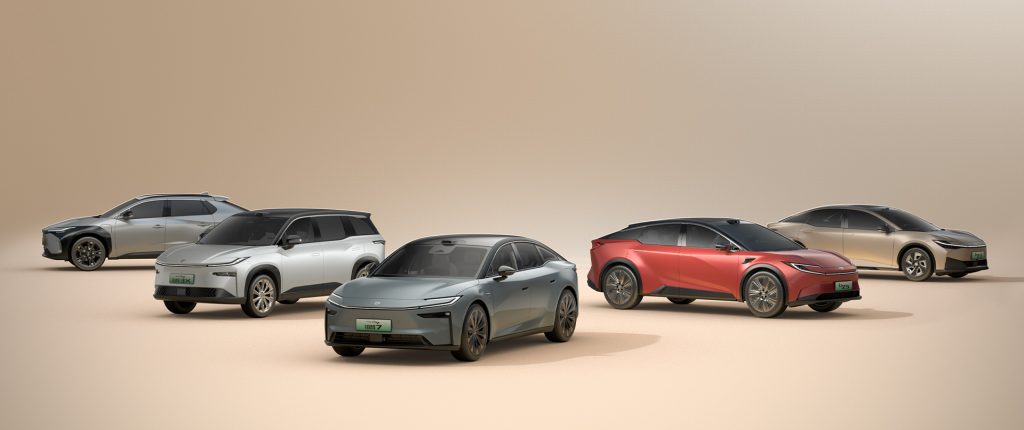
![[CONSUMER INSIGHTS] WHAT SHOULD CHINA LUX. NEVS LOOK LIKE?](http://www.zingevs.com/wp-content/uploads/2025/07/DM_20250705201845_001-1024x514.jpeg)


Retail: In May 2025, China’s passenger vehicle retail sales reached 1.932 million units, up 13.3% YoY and 10.1% MoM. Cumulative retail sales from January to May totaled 8.811 million units, a 9.1% YoY increase. Historically, retail sales follow a “low first, high later” annual trend. May 2025 sales grew 6% compared to the previous peak of 1.81 million units in May 2018, reflecting robust growth.
May 2025 had only 19 working days, two fewer than May 2024, with the Dragon Boat Festival on May 31 affecting stable production and sales. However, improving trade conditions supported strong market performance.
Post-Lunar New Year demand, driven by the “Two Renewals” policy (scrappage and trade-in), sustained market momentum. Local governments implemented consumption incentives, and offline events like auto shows boosted May sales. According to the Commerce Ministry, 4.12 million applications were filed for trade-in subsidies by May 31, with 1.23 million in May alone (up 13% MoM). Trade-ins accounted for ~70% of private purchases, while first-time buyers fell to ~30%, signaling consumption upgrade dominance.

CPCA, XI’AN BI-ANNUAL CONFERENCE, JULY 2025
May 2025 Key Features:
- Retail, wholesale, and production hit record highs.
- Jan-Apr retail growth was 7.9%, accelerating to 13.3% in May (+220k YoY), lifting Jan-May growth to 9.1%, exceeding expectations.
- Price wars eased, but hidden discounts (e.g., model updates, owner benefits) persisted. NEV promotions rose 1.6% MoM (to 11%).
- Chinese brands held 69.4% wholesale share (+6% YoY) and 65.2% retail share (+8% YoY), maintaining strong growth.
- Total inventory dropped 110k units (vs. 90k drop YoY); NEV inventory also declined.
- NEV retail penetration rose to 52.9%, fueled by scrappage/trade-in policies and NEV tax exemptions.
- Jan-May exports:
- ICE vehicles: 1.05 million (-14% YoY).
- NEVs: 640k (+95% YoY), accounting for 37.9% of exports.
- Russian market share held above 55% despite export declines.
Performance by Segment:
- Chinese Brands:
- Retail: 1.26 million (+29% YoY, +9% MoM); 65.2% share (+8 p.p. YoY).
- Jan-May share: 64% (+7.9 p.p. YoY), led by BYD, Geely, Chery, and Changan.
- Joint Ventures (JV):
- Retail: 470k (-5% YoY, +7% MoM).
- German brands: 15.3% share (-3.3 p.p. YoY).
- Japanese brands: 12.6% share (-2.2 p.p. YoY).
- American brands: 5.2% share (-1.5 p.p. YoY).
- Luxury Vehicles:
- Retail: 200k (-18% YoY, +19% MoM); 10.3% share (-3.9 p.p. YoY).
Production, Wholesale & Exports:
- Production: 2.27 million (+12.6% YoY, +1.8% MoM).
- Wholesale:2.31 million (record high; +12.8% YoY, +5.5% MoM).
- Chinese brands: 1.60 million (+24% YoY).
- JVs: 461k (-3% YoY).
- Luxury: 237k (-13% YoY).
- Exports:448k (+13.5% YoY, +6% MoM).
- NEVs: 200k (+80.9% YoY, 44.5% of total exports).
- Chinese brands: 375k (+18% YoY); JVs/luxury: 73k (-2.2% YoY).

NEV Highlights:
- Production: 1.167 million (+30.2% YoY, +1.1% MoM).
- Wholesale: 1.216 million (+33.0% YoY, +7.0% MoM).
- Retail: 1.021 million (+28.2% YoY, +12.1% MoM).
- Exports: 200k (+80.9% YoY).
Segment Breakdown:
- Wholesale Penetration:52.6% (+8.0 p.p. YoY).
- Chinese brands: 68.7%; luxury: 37.5%; JVs: 4.3%.
- BEVs: 754k (+37.7% YoY); PHVs: 341k (+20.1% YoY); EREVs: 122k (+46.7% YoY).
- Top Models (Wholesale >20k): 15 models led by BYD Song (74,949), Tesla Y (39,527), and Xiaomi SU7 (28,013).
2. JUNE 2025 OUTLOOK
- 20 working days (+1 vs. 2024), with stable post-holiday demand.
- PMI rose to 49.5%, signaling economic expansion. Trade talks support export growth.
- Challenges: Tightening auto loans may pressure dealer profits and limit promotions.
- Opportunities: NEV rural subsidies target migrant workers (50+ age group: 31.4% of workforce).
3. JAN-APR 2025 AUTO INDUSTRY FINANCIALS
- Revenue: ¥3.3 trillion (+7% YoY).
- Profit: ¥132.6 billion (-5% YoY); margin: 4.1% (below industrial average of 5.6%).
- Policy-driven production: 10.12 million units (+11% YoY).
4. APRIL 2025 EXPORT PERFORMANCE
- Total exports: 620k (+12% YoY, +36% MoM).
- Top Markets: Mexico (49,139), Brazil (41,404), UAE (31,146).
- NEV exports: Belgium, Mexico, Brazil, and SEA lead gains; Russia declines sharply.
5. JAN-APR 2025 IMPORTS
- Total imports: 135k (-35% YoY), with continued declines in ICE demand.
- Top Sources: Japan (18,279), Germany (7,864), USA (6,848).
6. CHINA’S GLOBAL SHARE (JAN-APR 2025)
- 33% of global sales (1.006 million units, +11% YoY).
- Leading OEMs: BYD (world #6), Geely (#9).
- Regional Trends: USA (+5%), Japan (+13%); Russia, Germany (-4%).
All data is sourced from CPCA. For collaboration inquiries, please contact us to engage in in-depth cooperation with CPCA.
